Apitally Review - Simple Yet Powerful API Analytics in 2025
We've tested Apitally, a developer-friendly tool that provides analytics, logging and monitoring for REST APIs
Welcome to this Apitally review 😊!
As developers, monitoring and understanding how our APIs are being used is crucial - yet it often feels unnecessarily complex. Most solutions either require complicated setups or provide overwhelming amounts of data that's hard to make sense of.
That's where Apitally comes in with a refreshingly simple approach: just add two lines of code to your project, and you get deep insights into your API with analytics, monitoring and logging!
Let's dive in and see if Apitally lives up to its promise of making API analytics easy! With a rich set of features designed for API monitoring, this is going to be an in-depth review that covers everything you need to know. Don't hesitate to use the menu on the right to navigate to the sections that interest you!
A Privacy-First Approach
One of Apitally's standout features is its commitment to data privacy. The tool was built by Simon, who works in the healthcare sector and uses Apitally in production - making privacy a core requirement rather than an afterthought.

The tool offers two distinct approaches to data collection:
- Metrics & Analytics: Works entirely with aggregated data, processed client-side
- Request Logging (optional): Full control over what gets logged, with built-in masking and exclusion rules
This makes Apitally suitable even for industries with strict data protection requirements, like healthcare and financial services.
Getting Started
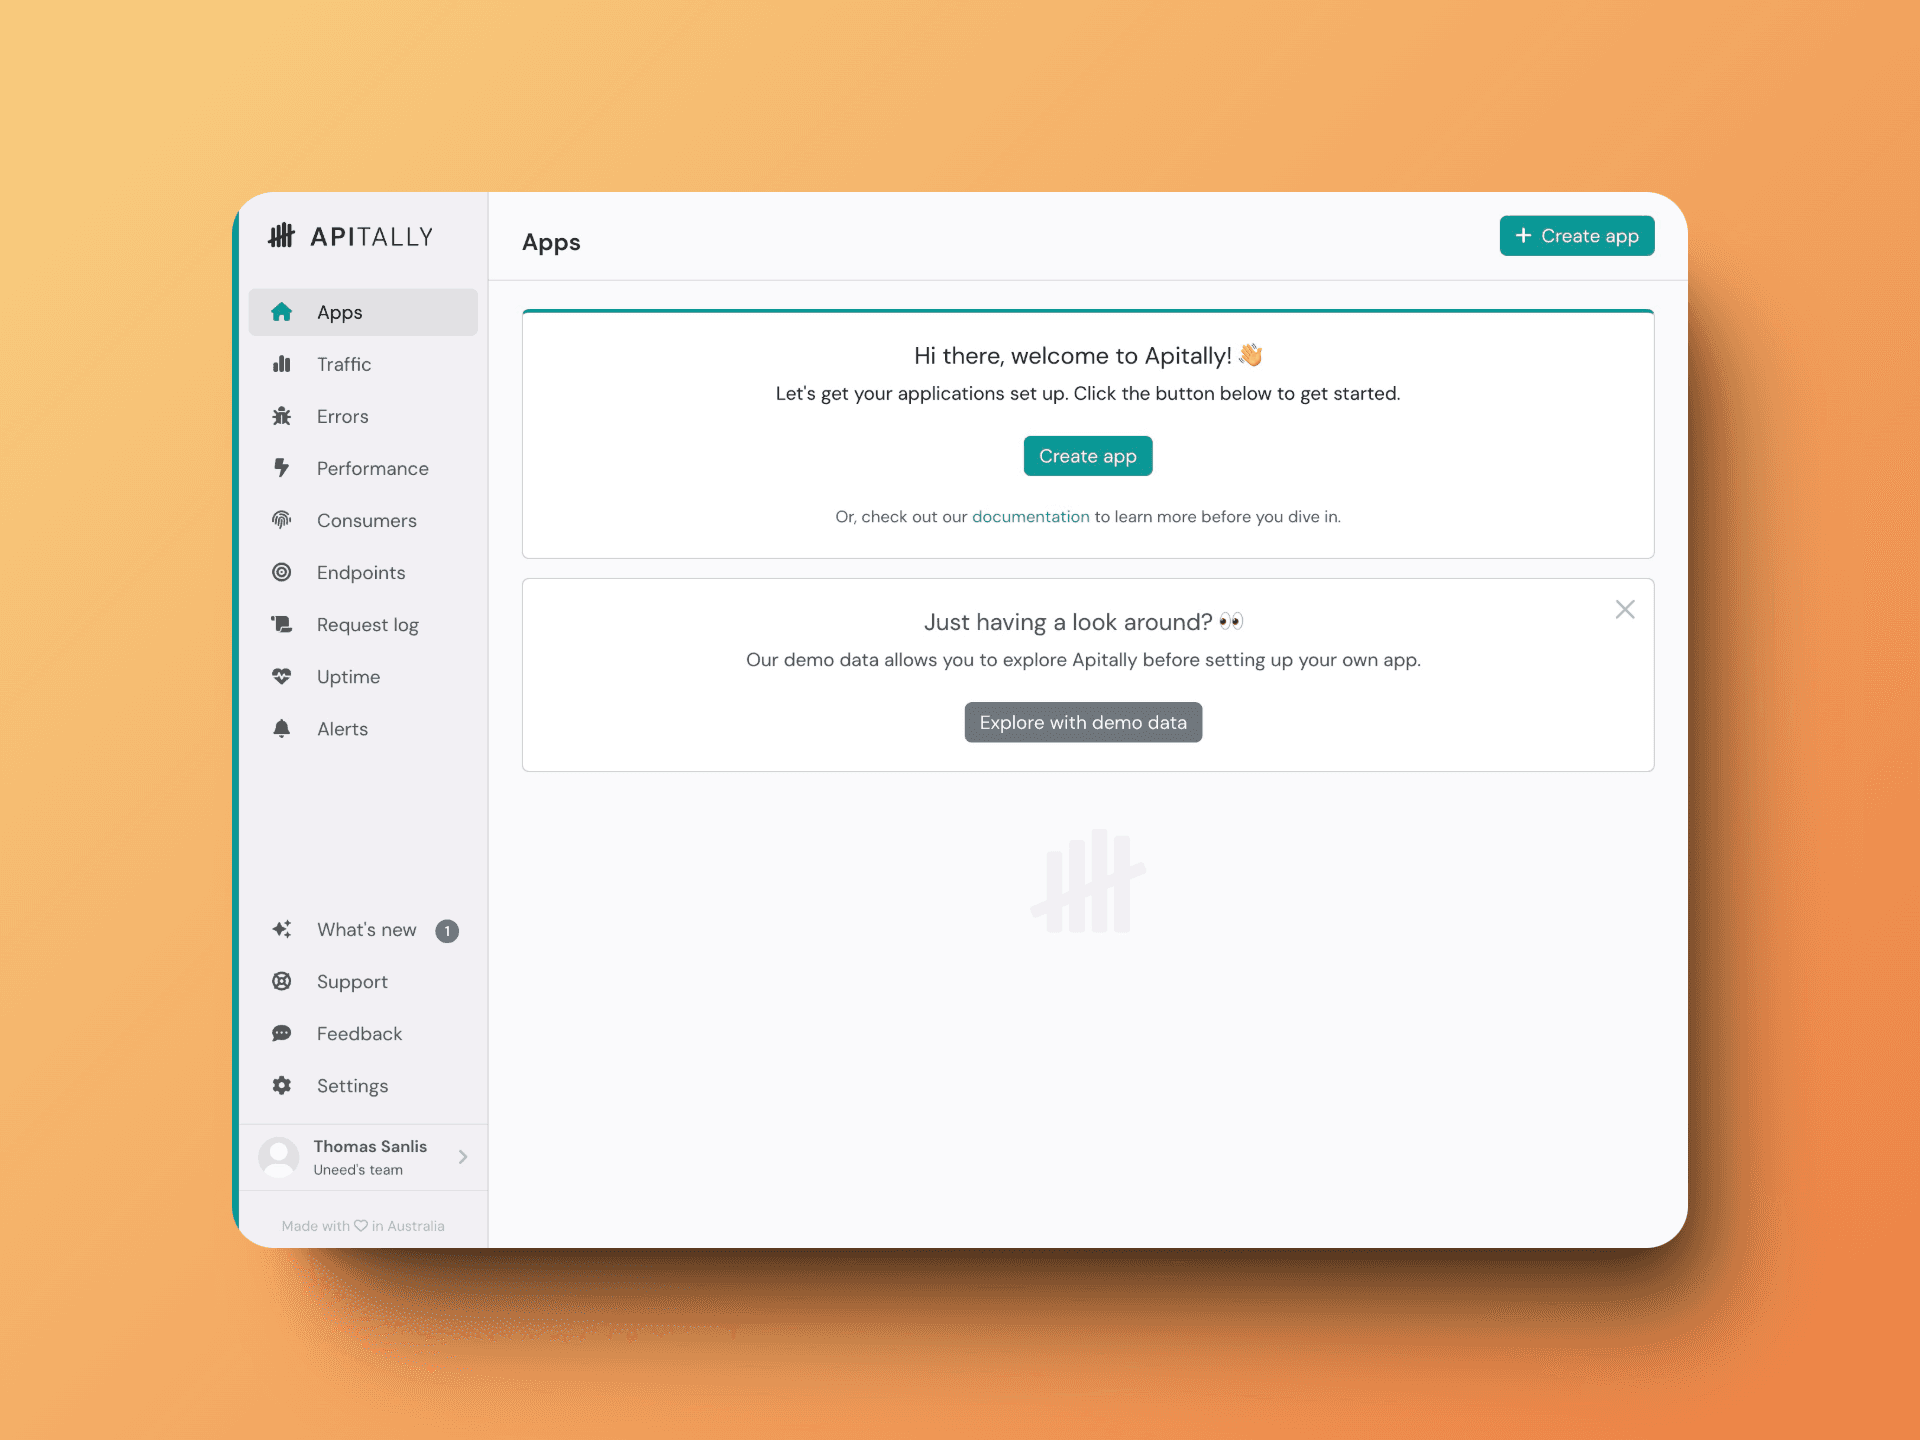
When you first log into Apitally, you're greeted with a clean, modern interface. The dashboard immediately gives you an overview of your APIs and their status. I decided to explore their demo data, because... Well because I don't have any interesting API to use 😅 (Uneed's API is in Supabase).
Setting up Apitally is refreshingly simple. The tool supports most popular web frameworks:
- Python: FastAPI, Flask, Django Ninja, Django REST Framework, Starlette, Litestar
- Node.js: Express, NestJS, Fastify, Koa, Hono
Integration requires just adding a couple of lines of code to your project - no complex configuration or infrastructure changes needed. For example, with FastAPI:
from fastapi import FastAPI
from apitally.fastapi import ApitallyMiddleware

app = FastAPI()
app.add_middleware(ApitallyMiddleware, client_id="your_client_id")
Traffic Monitoring
What immediately stands out is how well-organized everything is. The interface shows your different applications (in our demo case, the Boundless Bookstore API), complete with environment tags (prod, dev, staging) and a quick status graph. Each API shows the number of active instances and consumers, making it easy to grasp the scale of your operations at a glance.
The traffic monitoring section provides a comprehensive view of your API's activity:
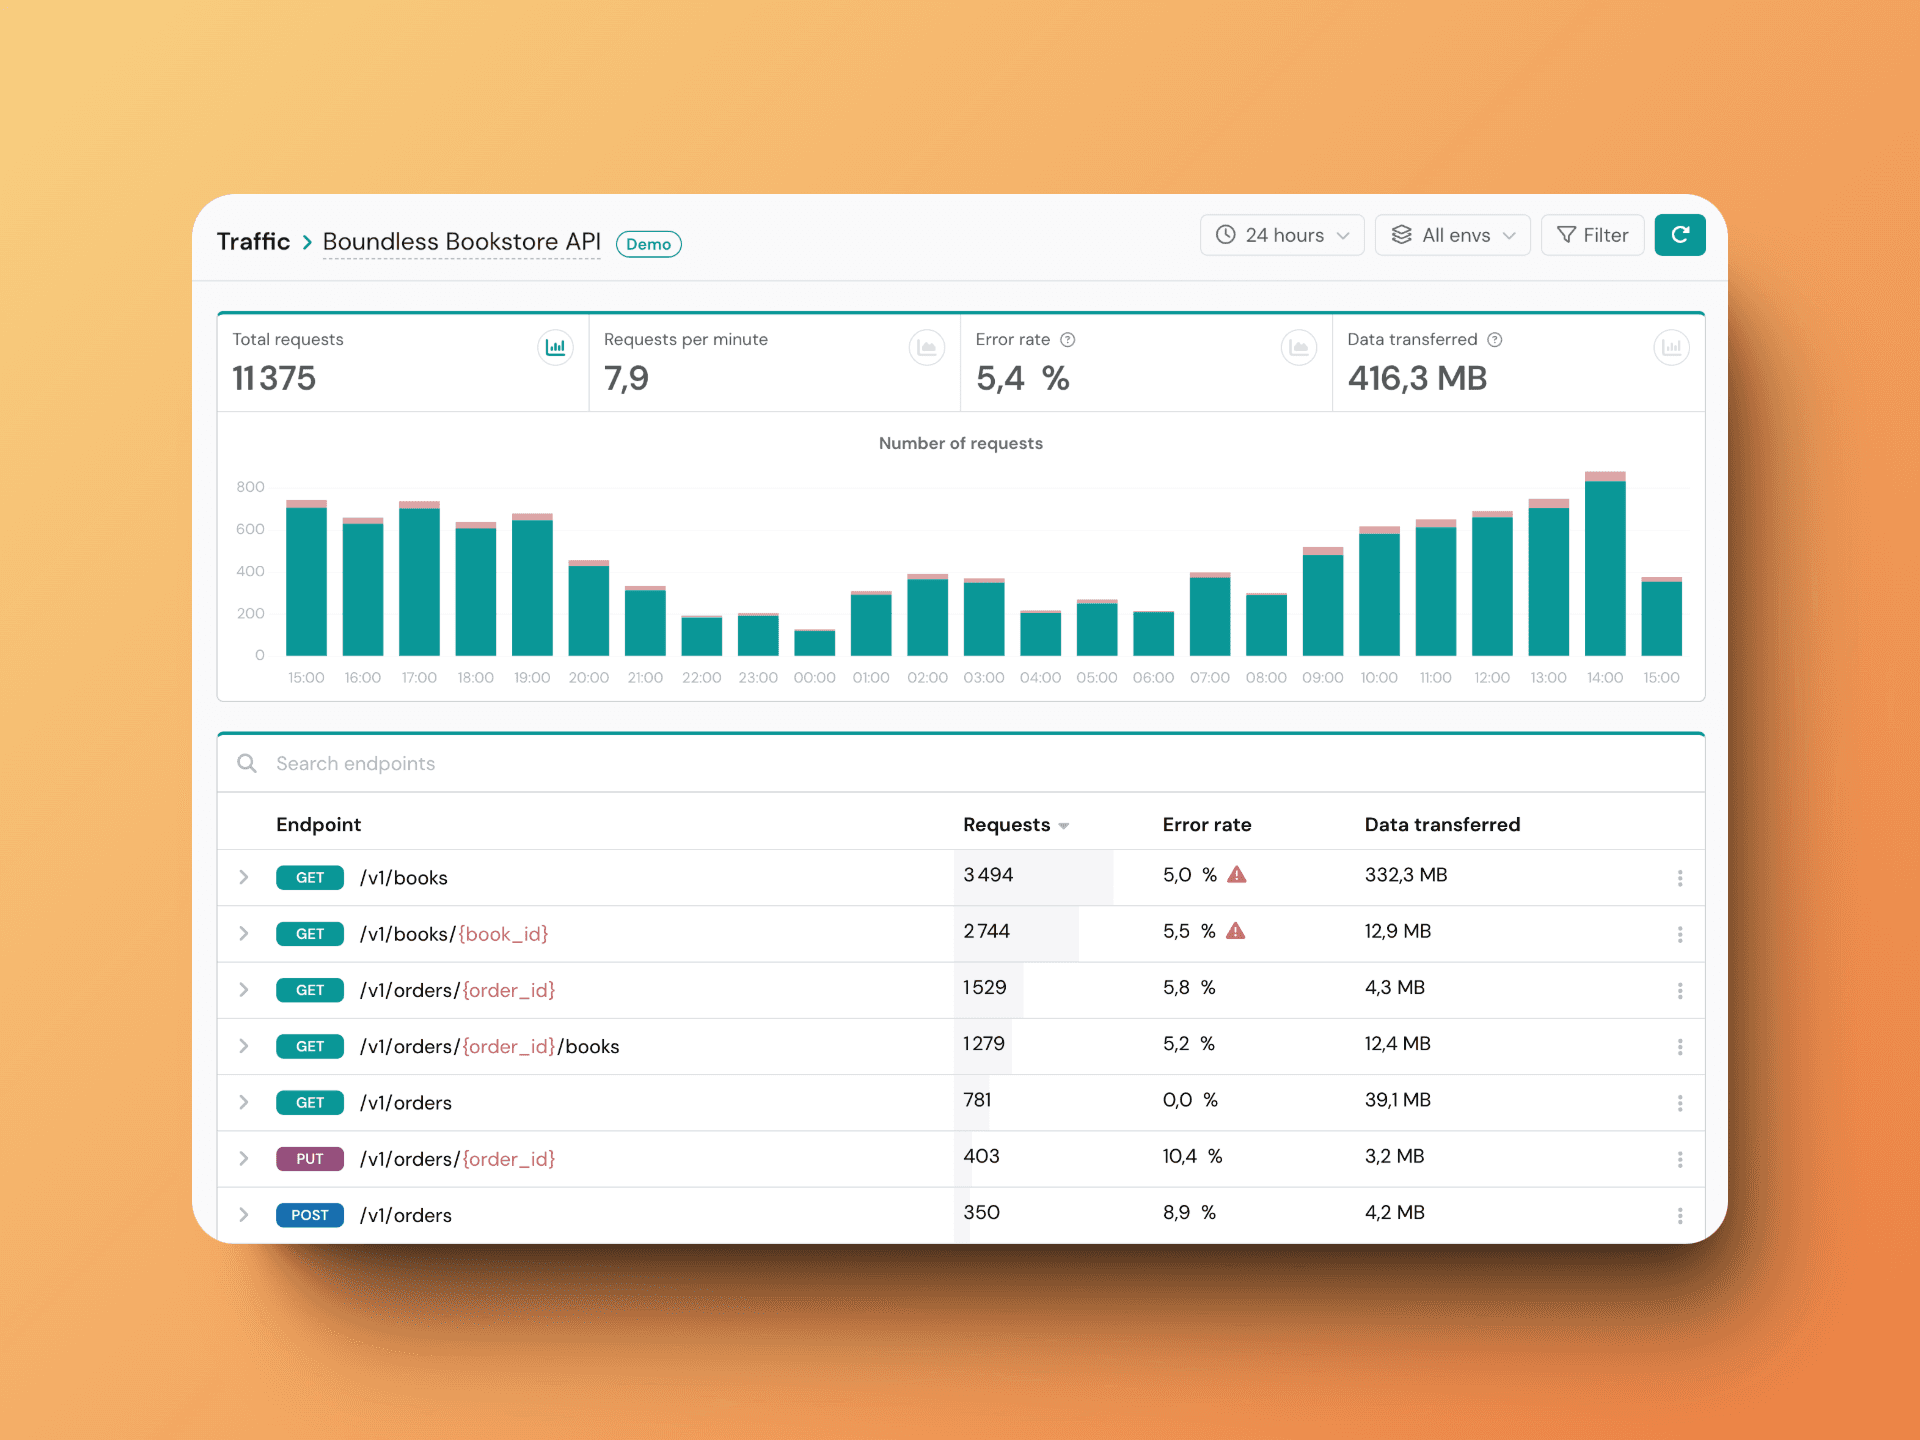
In this demo, we can see real metrics like total requests, requests per minute, error rates, and data transferred.
Very useful for understanding how your API is being used in real-time 🙌🏻!
Error Tracking
One of Apitally's strongest features is its error tracking capability. The error dashboard provides a clear breakdown of both client and server errors, making it easier to identify and fix issues quickly.
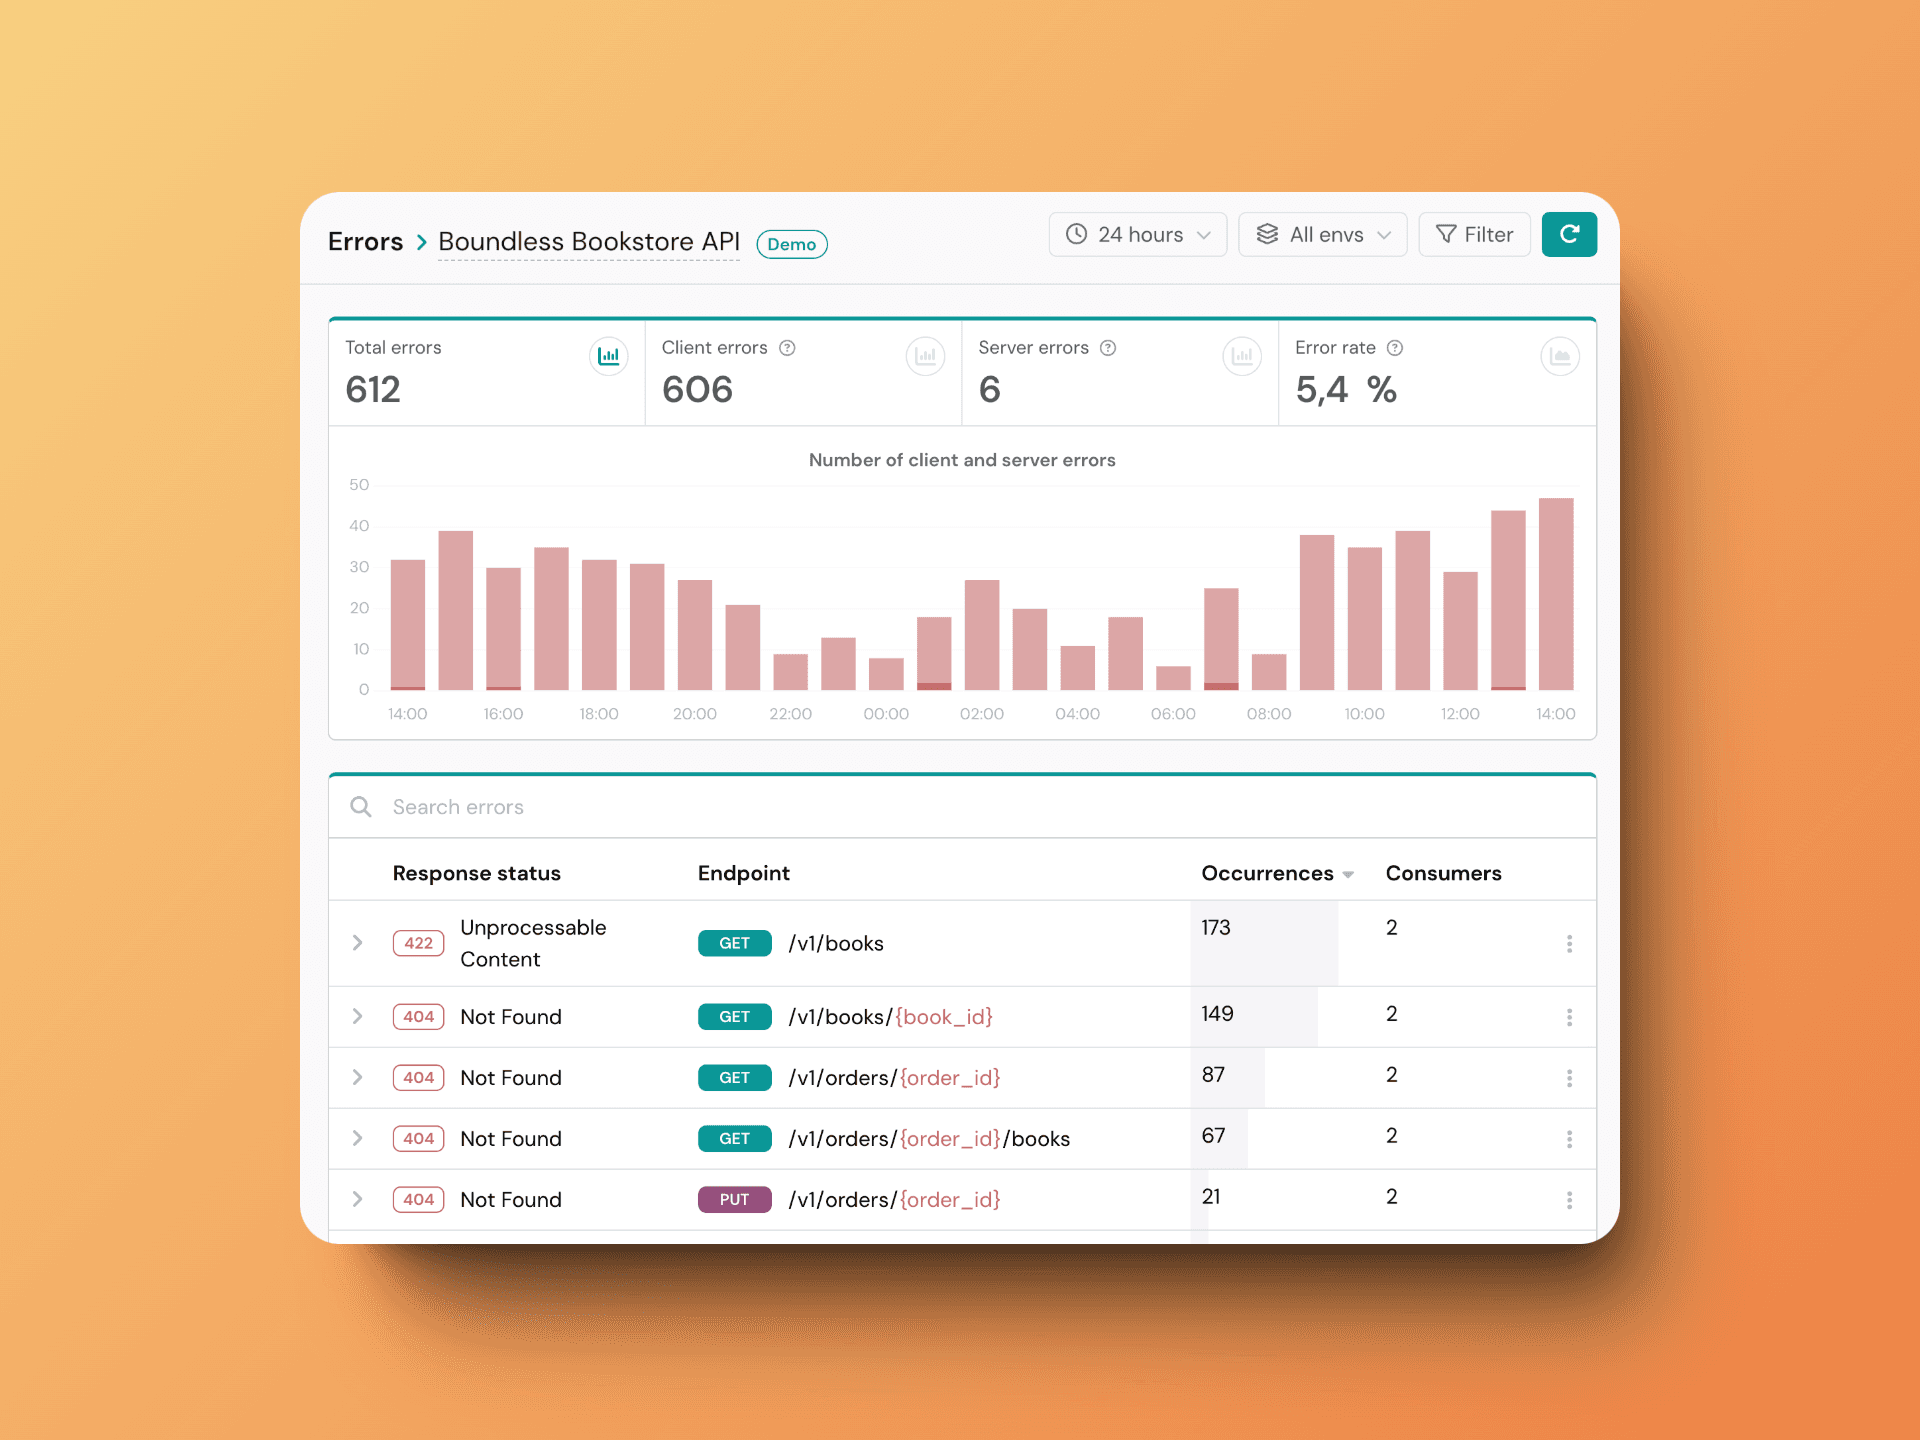
What's particularly useful is how Apitally breaks down errors by endpoint. For instance, we can see that the /v1/books endpoint has 173 "Unprocessable Content" errors, with detailed validation messages showing exactly which fields failed validation and why - helping developers quickly identify and fix the root cause.
Performance Analytics
The performance monitoring section is IMO where Apitally really shines. It uses the industry-standard Apdex score to measure user satisfaction with response times:
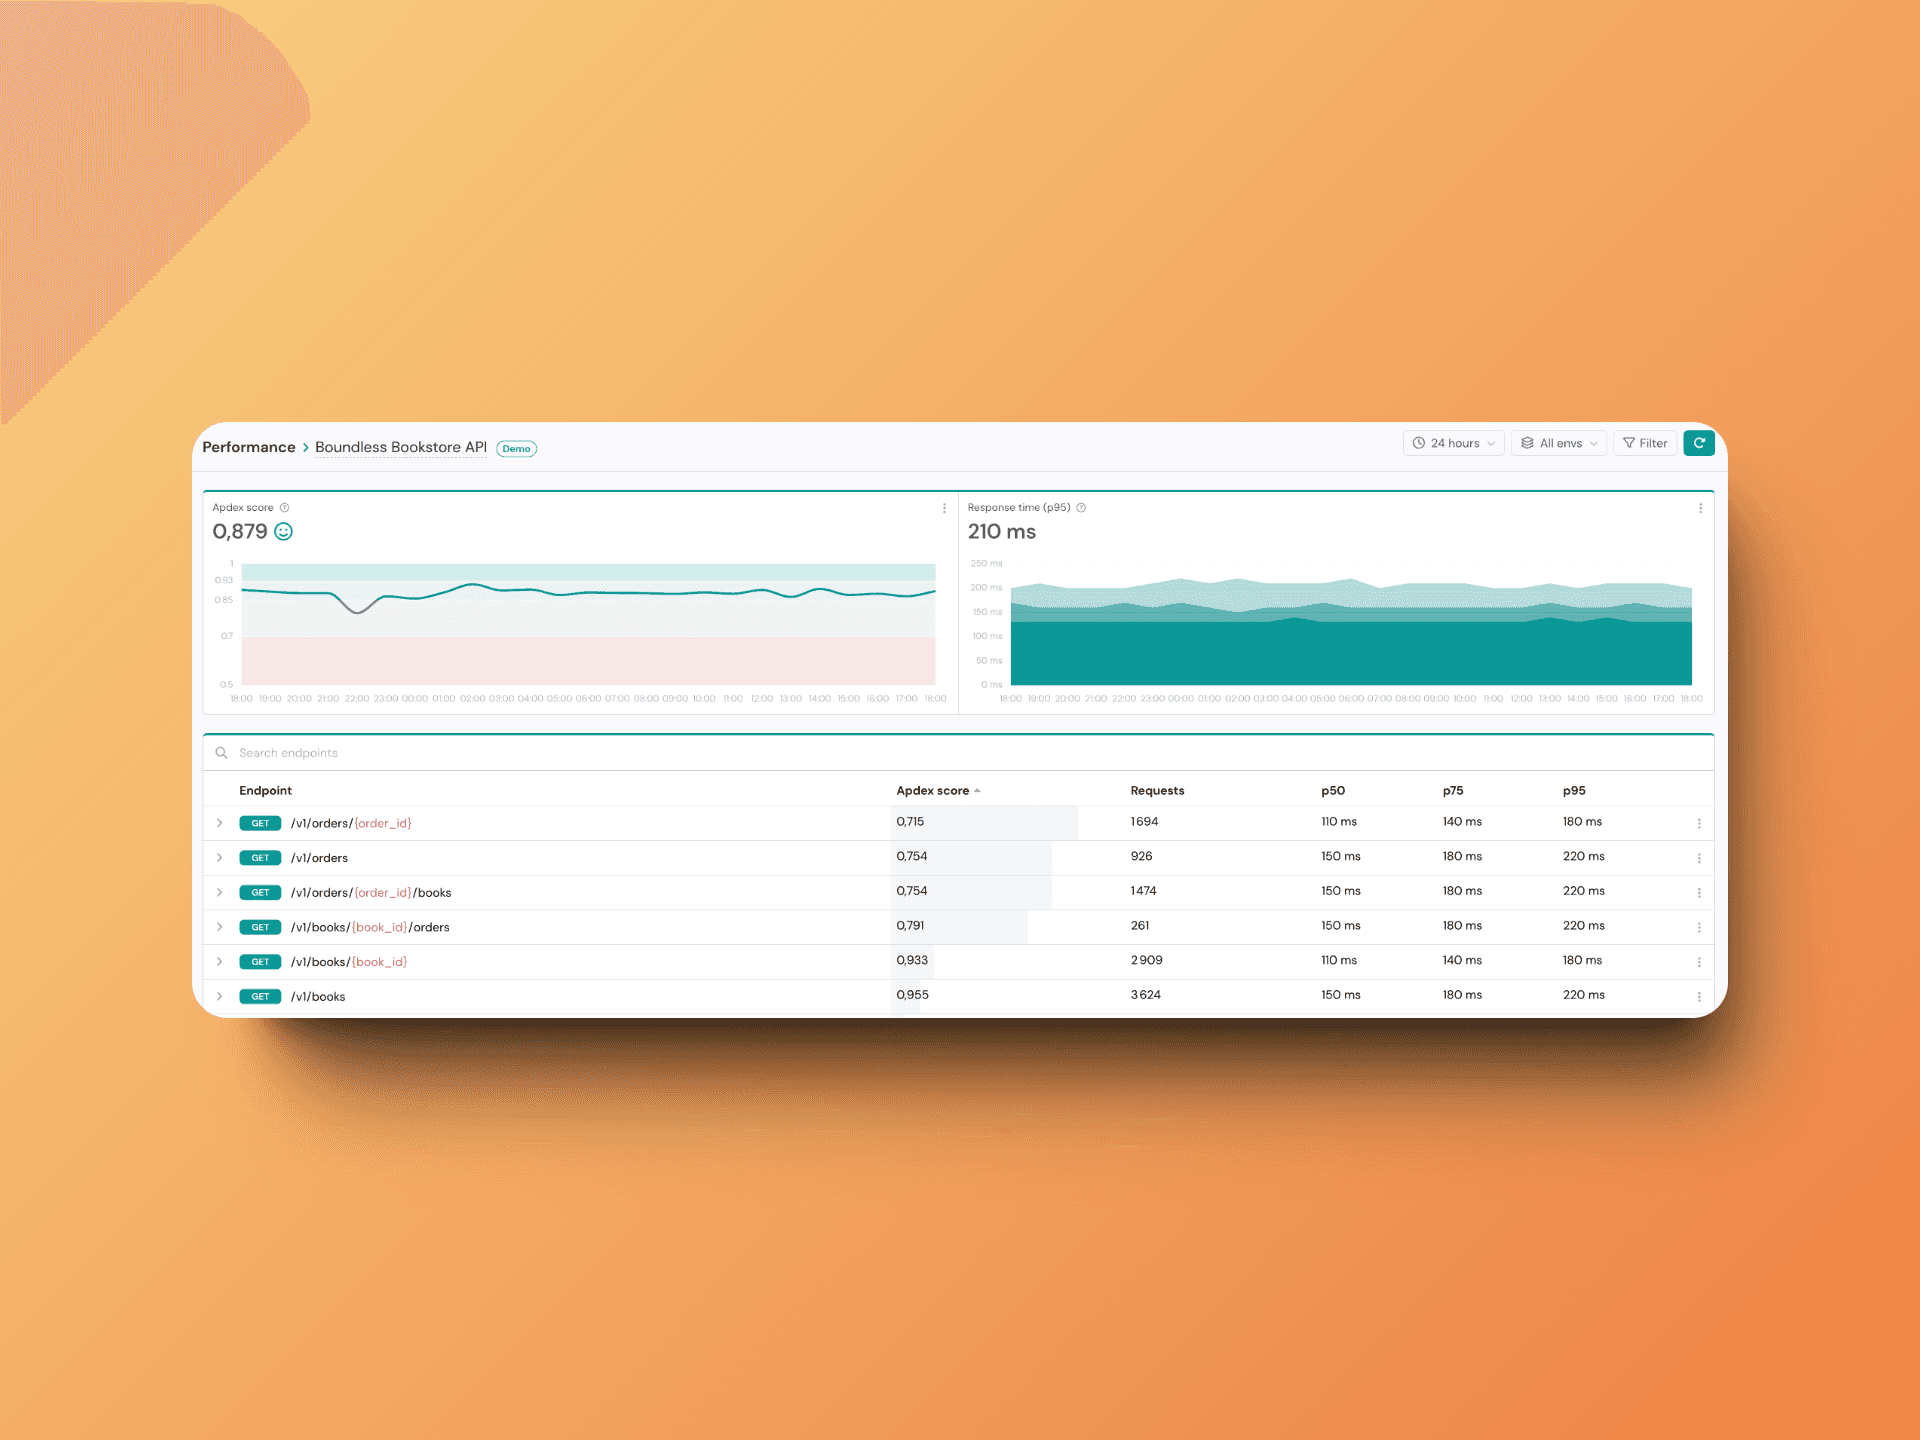
What I particularly love here is the detailed breakdown per endpoint. For each API route, you can see:
- Apdex score (ranging from 0 to 1)
- Response time percentiles (p50, p75, p95)
- Total request count
For example, the /v1/books endpoint has an impressive Apdex score of 0.953, handling 3,884 requests with response times consistently under 220ms - exactly what you'd want for a high-traffic endpoint 🚀!
Understanding API Consumers
A standout feature of Apitally is its ability to track and analyze individual API consumers. This gives you unprecedented visibility into how different clients are using your API:
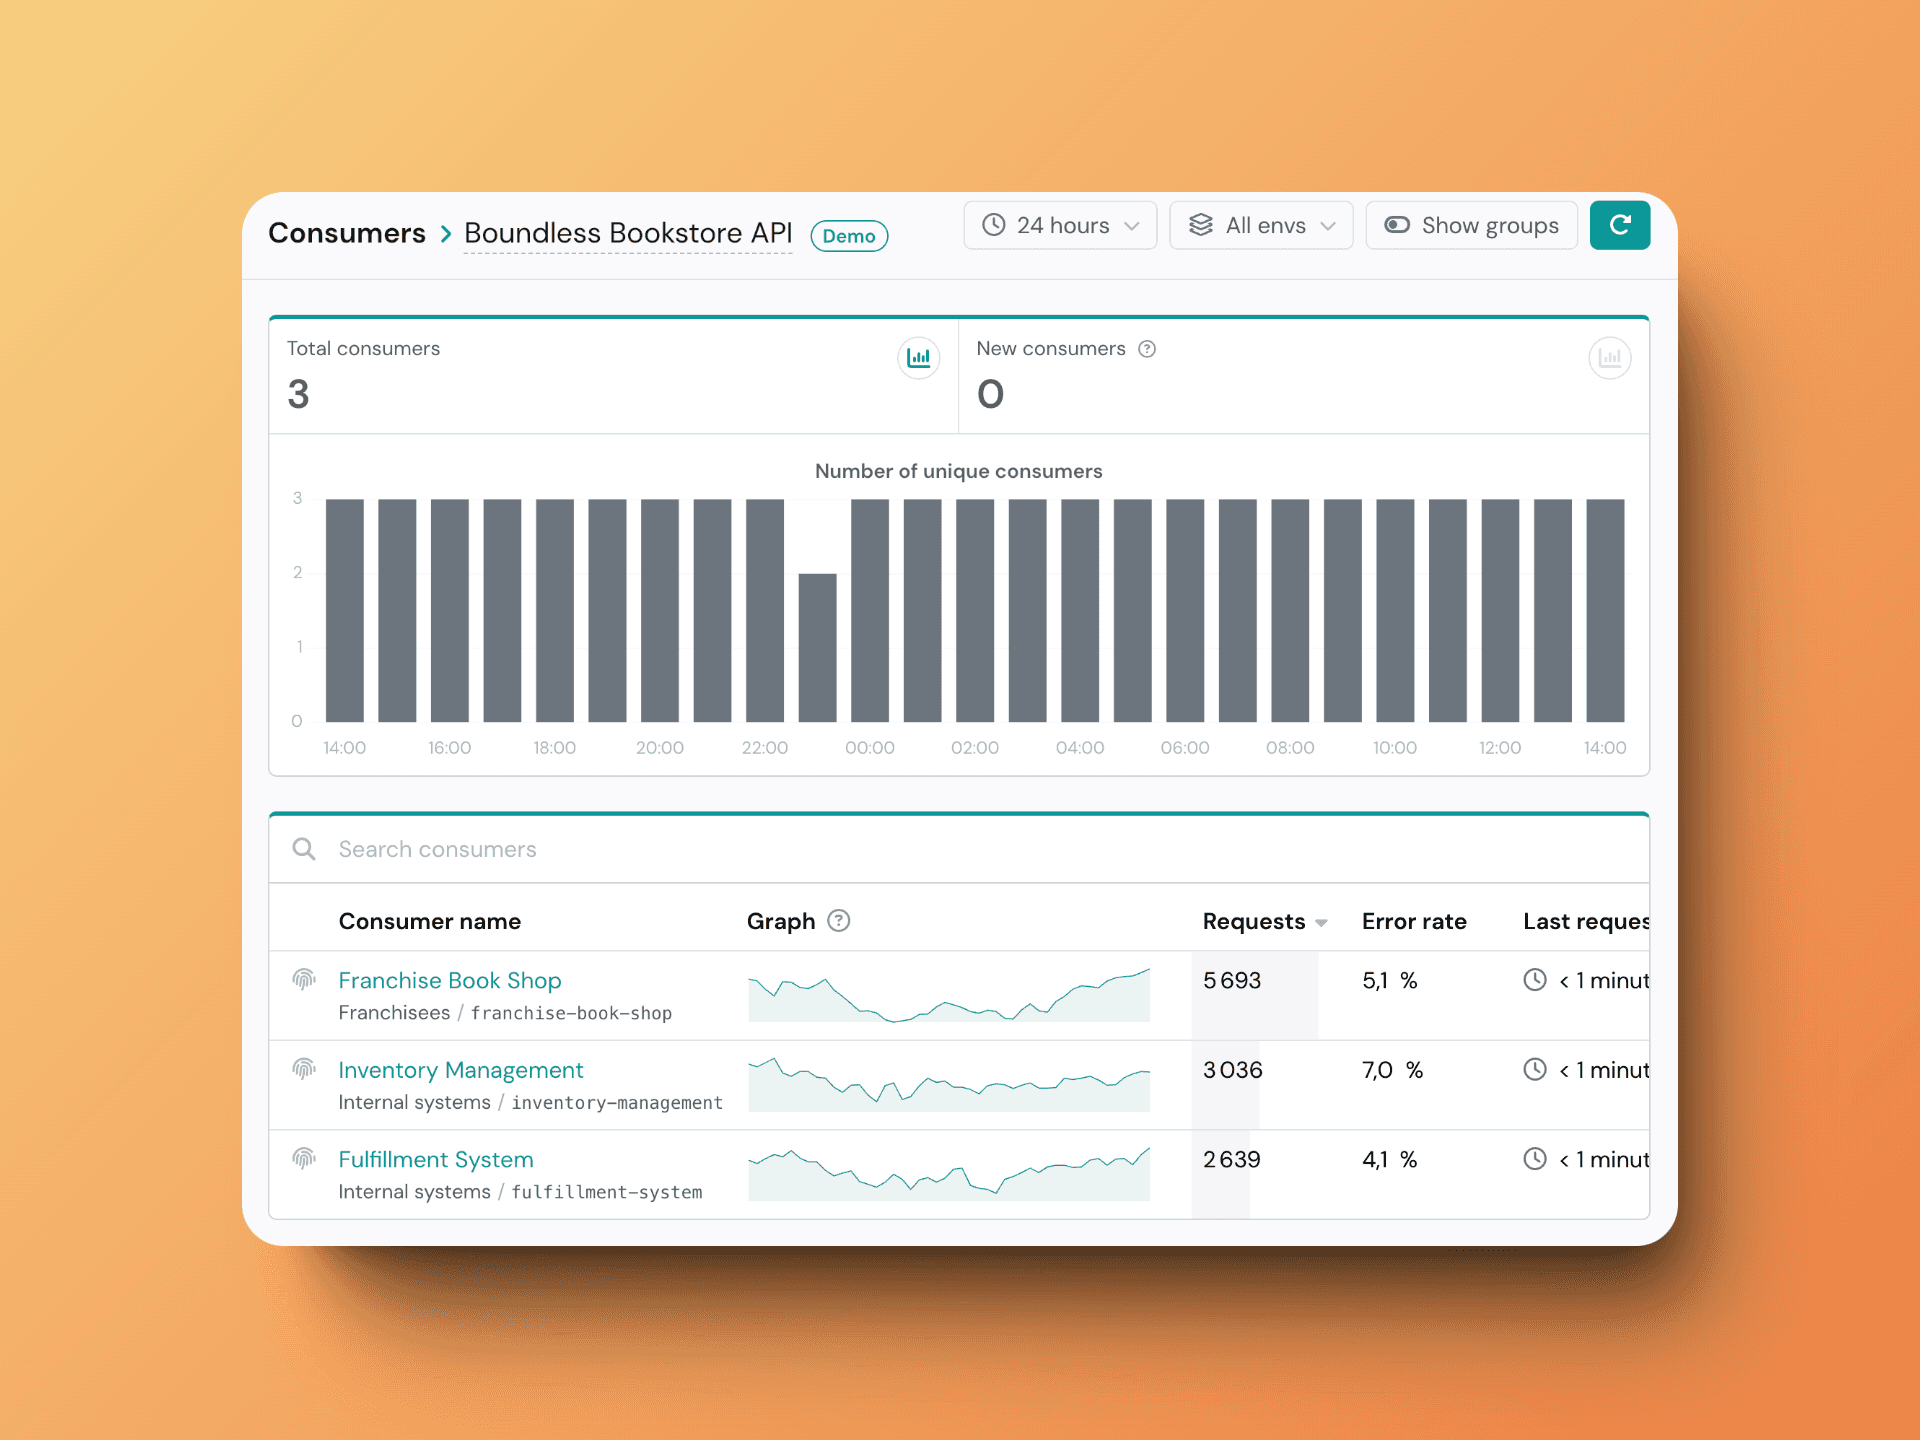
This segmentation is incredibly useful for understanding your API's usage patterns and identifying potential issues with specific consumers. The time-series graphs for each consumer make it easy to spot unusual patterns or usage spikes.
Request Logging & Debugging
For more detailed analysis, Apitally provides a powerful request logging system that's invaluable for customer support and troubleshooting. When a customer reports an issue, you can quickly locate their specific requests, see exactly what data was sent, and identify what went wrong.
The comprehensive filtering options let you zero in on relevant requests by status code, consumer, endpoint, data size, or response time. This makes investigating issues incredibly efficient - whether you're debugging a failed integration or analyzing performance bottlenecks.
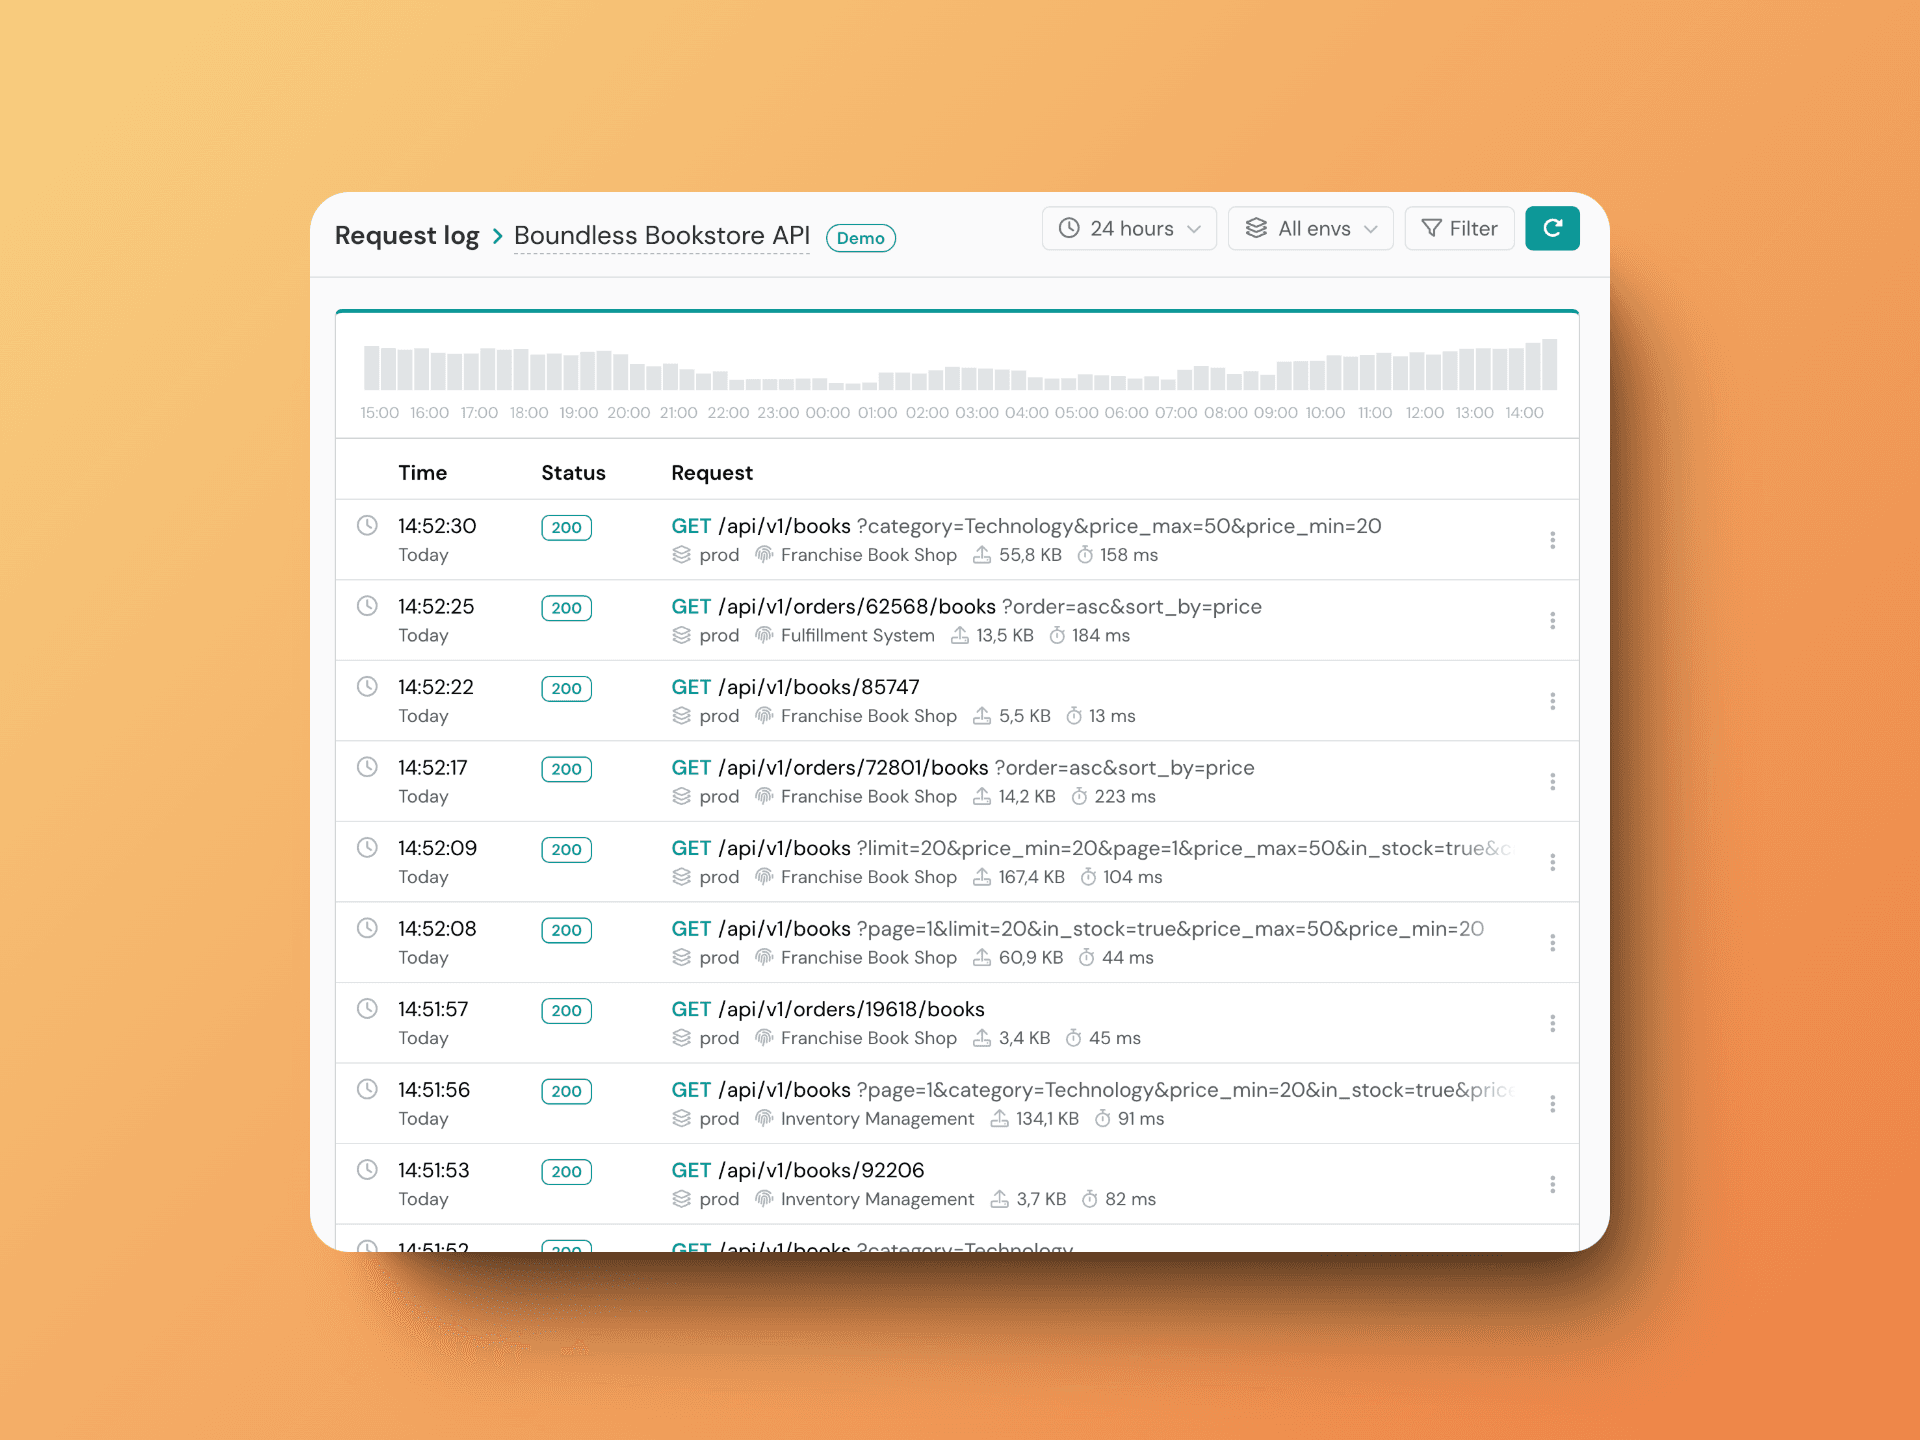
Each logged request can be expanded to reveal:
- Full request URL with query parameters
- Request and response headers
- Request and response bodies (when logging is enabled)
- Response status code
- Consumer identifier
- Response time
- Data transfer size
- Environment information
A standout feature is the ability to drill down directly from analytics dashboards to individual requests. When investigating an error spike or unusual traffic pattern, you can jump straight to the underlying requests with a single click.
Monitoring & Alerting
Being the first to know when something goes wrong with your API is crucial. Apitally's monitoring system combines proactive health checks with intelligent alerting to help you maintain reliable service.

The monitoring interface provides real-time visibility into your API's health:
- Health Checks: Automatic monitoring of your API's availability through regular HTTP requests
- Uptime Tracking: Visual timeline of your API's uptime, broken down by environment
- Heartbeat Monitoring: Ensures your application is running and sending regular updates
The alerting system is both powerful and flexible, allowing you to catch issues before they impact your users. You can configure alerts based on various metrics and thresholds:
- High error rates (e.g., > 5% in 15 minutes)
- Slow response times (e.g., median > 1 second)
- Traffic spikes (e.g., > 500 requests/hour)
- Server errors or health check failures
- Custom thresholds for any metric
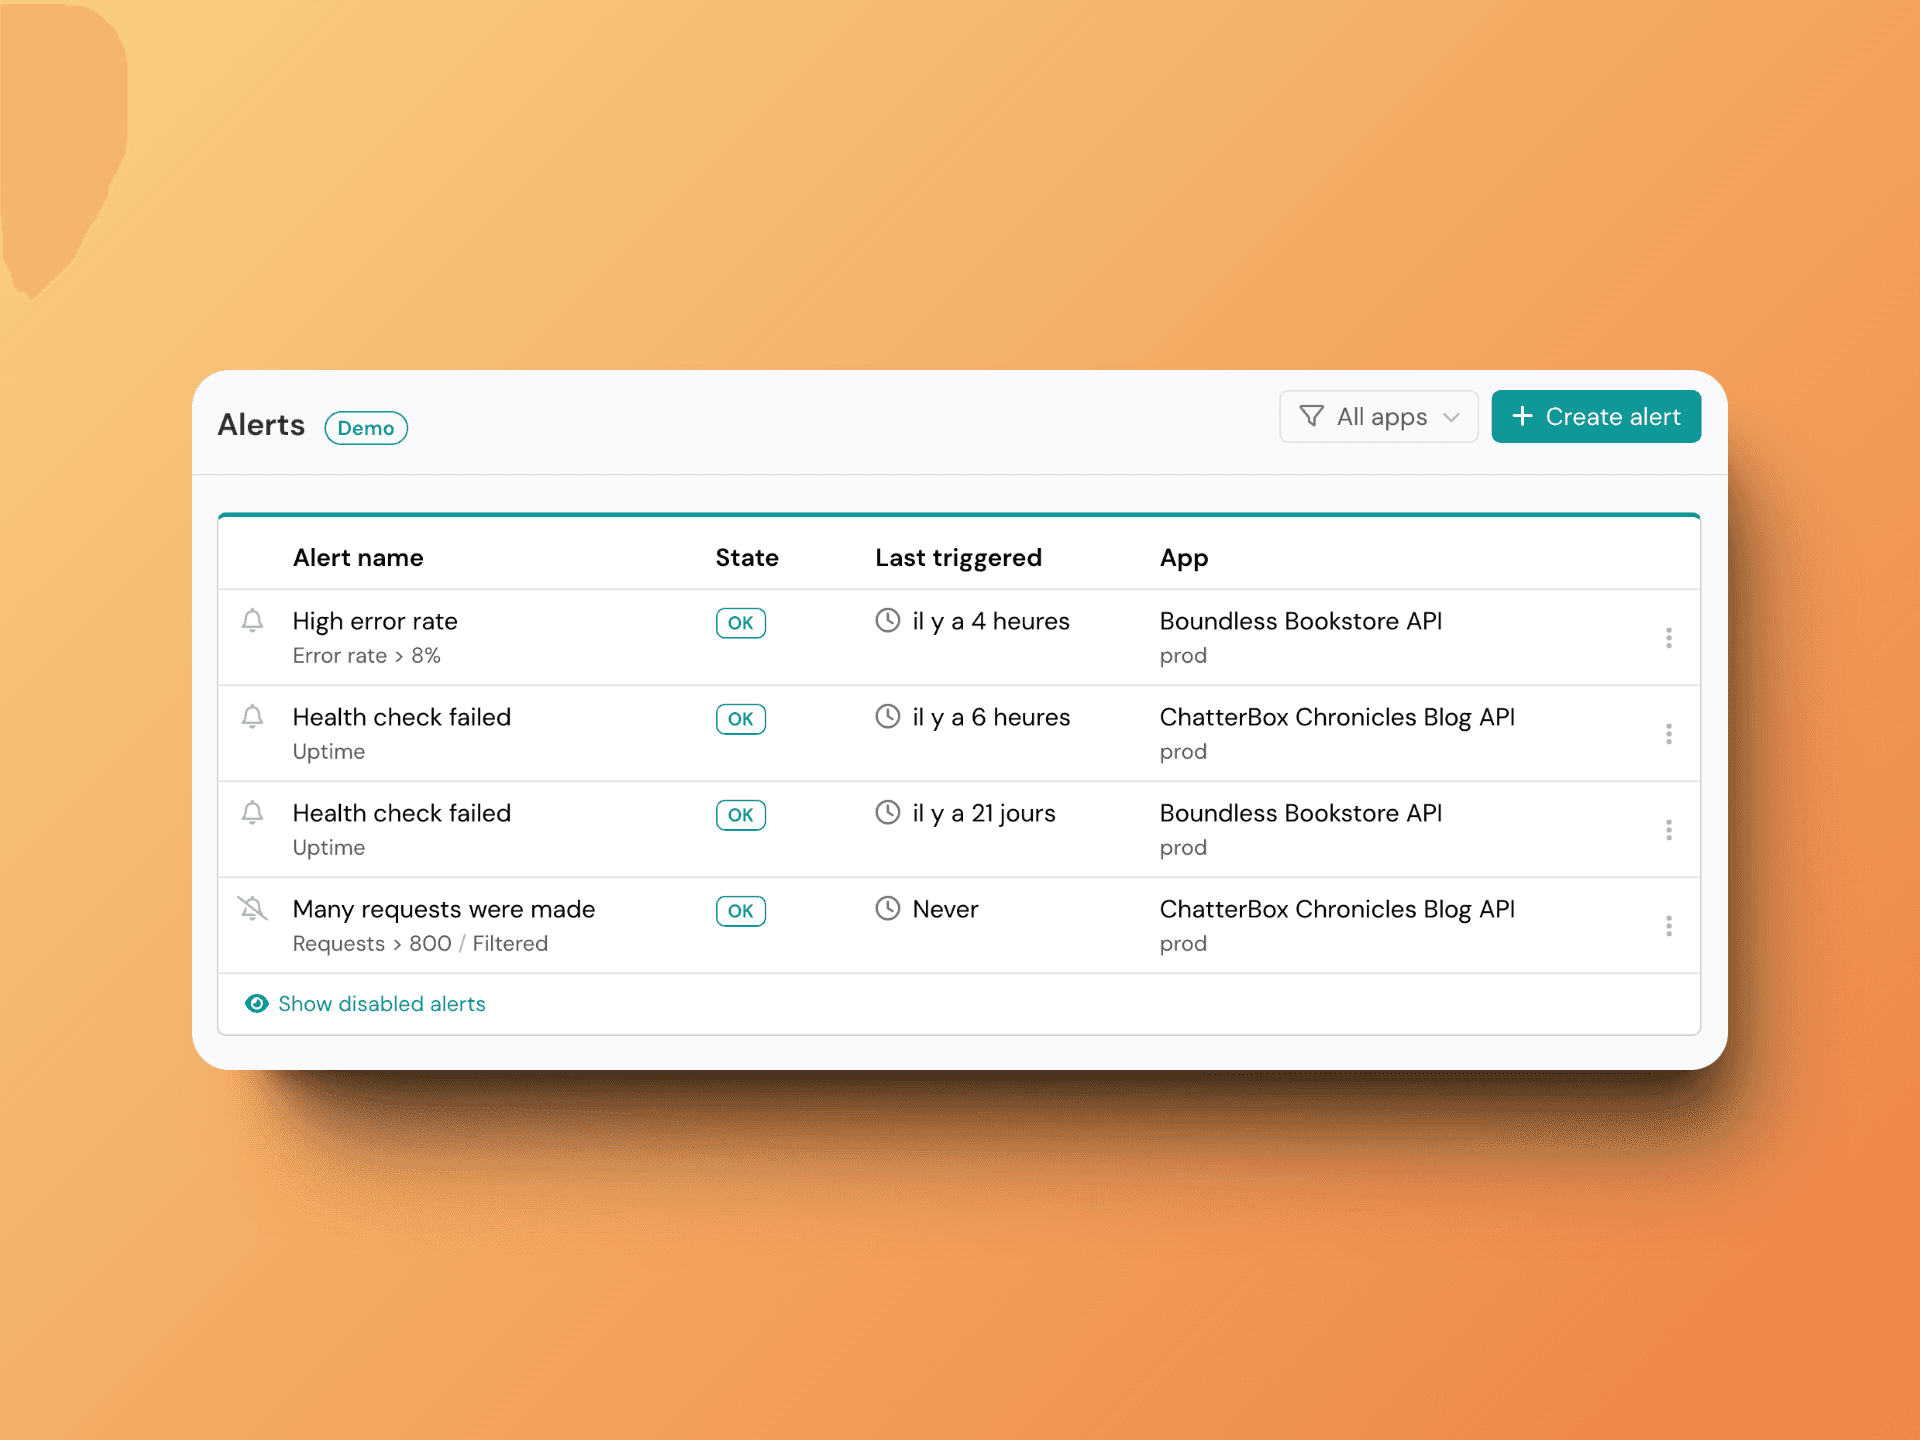
Alerts can be delivered via email, Slack, or Microsoft Teams, ensuring your team stays informed through their preferred channels 😎!
Pricing
Apitally offers three plans: a free tier for hobby projects, a Starter plan at $39/month that includes up to 3 apps and 1M logged requests, and a Premium plan at $119/month with support for 10 apps and 5M logged requests.
All paid plans include the full feature set 🎉
Conclusion
After spending time testing and writing this Apitally review, I'm genuinely impressed by how it manages to be both powerful and user-friendly. Whether you need FastAPI metrics, Express monitoring, or NestJS analytics, Apitally is a great solution for API monitoring that's both powerful and easy to use.
What I loved:
- 🚀 Incredibly simple setup - just two lines of code!
- 🔒 Privacy-first approach with client-side aggregation
- 📊 Clean, intuitive dashboards
- 🔍 Comprehensive request logging with privacy controls
- ⚡ Real-time monitoring and alerting
- 👥 Detailed consumer analytics
For small engineering teams and product owners looking for API analytics and monitoring, Apitally offers an excellent balance of features and simplicity. Whether you're using FastAPI, Express, or any other supported framework, you'll get valuable insights into your API's usage, errors and performance without compromising on privacy or spending hours on setup.
The thoughtful design, privacy features, and comprehensive monitoring make it a solid choice for teams that need professional API analytics without the enterprise complexity and the high price tag 🤩!
TakeMyMoney.io Review - Product Tracking & Alerts
We've tested TakeMyMoney.io, a powerful product tracking platform that helps you never miss restocks and price drops on your favorite items
IP Geolocation Review - Complete IP Intelligence
We've tested IP Geolocation, your complete IP geolocation and timezone intelligence solution
Related Articles
